- U.S. Conditions
- Home
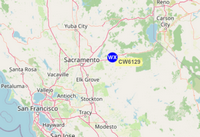
- Placerville California Weather

- Mobile Live Weather Conditions
- Mobile Placerville Forecast
- NOAA LIVE Weather Radio
- Air Quality Report
- Watering Index
- Irrigation Index
- Burn Index
- Current Area Weather Alerts
- LIVE I
- LIVE II
- Live III
- Live Weather Gauges
- LIVE WebCam
- Lightning Radar
- Miscellaneous
- Moon & Stars
- CoCoRaHS Precipation Map
- 2016 Solar Risings/Settings
- Daily Placerville Temp Summary
- Historic Daily Wx Extremes
- Historic Daily Temp Extremes
- Historic Rain/Temp Details
- Current Weather Trends
- Weather Station History
- Historic Weather Data
- Normals, Averages & Records
- 2 to 7 Day Wx Statistics
- Mesowest Current Conditions
- Monthly & Yearly Records
- Daily Weather Details
- Daily Rainfall Calendar
- Historic Rainfall
- Current Weather Graphs
- California Average Rainfall
- Current U.S. Weather & Info
- United States
- Current U.S. Weather Conditions
- North America Conditions
- Alaska Current Conditions
- Hawaii Current Conditions
- U.S. Weather Roundup w/temps
- Annual USA Rainfall
- Yesterday U.S. Temps
- U.S. Weather Advisory Map
- U.S. City Radiation Measurements
- Official U.S. Time & Zones
- Alaska
- Warnings-Watches-Advisories
- Annual Rainfall
- Live Meso Map Weather
- United States Weather
- Southwestern Weather Network
- Alaska Wx Conditions
- Mid-Atlantic Wx Conditions
- Mid-South Wx Conditions
- Midwest Wx Conditions
- Northeast Wx Conditions
- Northwest Wx Conditions
- The Plains Wx Conditions
- Rocky Mountain Wx Conditions
- Southeast Wx Conditions
- Southwest Wx Conditions
- Canada Weather
- Atlantic Region Wx Conditions
- Ontario Region Wx Conditions
- Quebec Region Wx Conditions
- Saskatchewan Region Wx Conditions
- Western Region Wx Conditions
- United Kingdom Weather
- United Kingdom Wx Conditions
- Europe Weather
- Europe Wx Conditions
- Austria Wx Conditions
- Benelux Wx Conditions
- Germany Wx Conditions
- Greece/Hellas Wx Conditions
- Iberian Peninsula Wx Conditions
- Scotland Wx Conditions
- Slovakia Wx Conditions
- Slovenia Wx Conditions
- Oceania Weather
- Australia Wx Conditions
- New Zealand Wx Conditions
- World Weather
- Global Affiliated Wx Network
- U.S. Climate Central
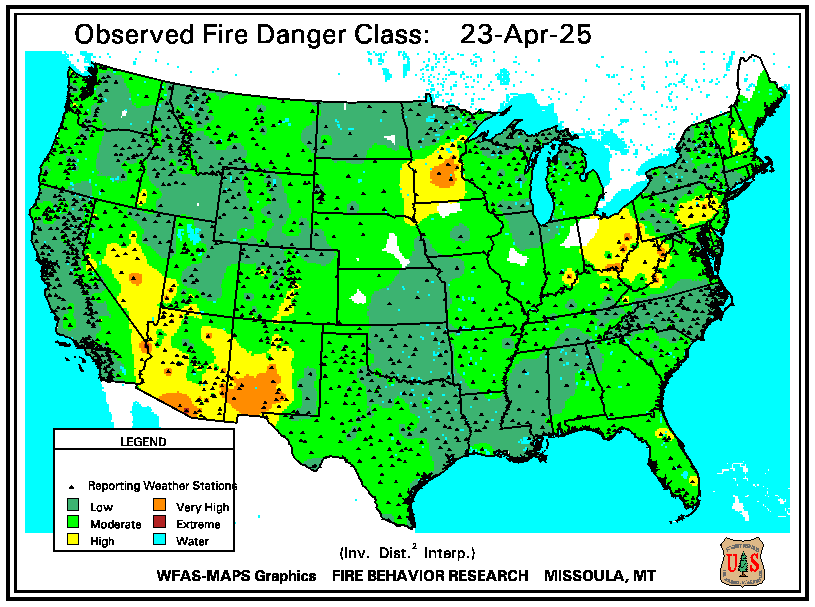
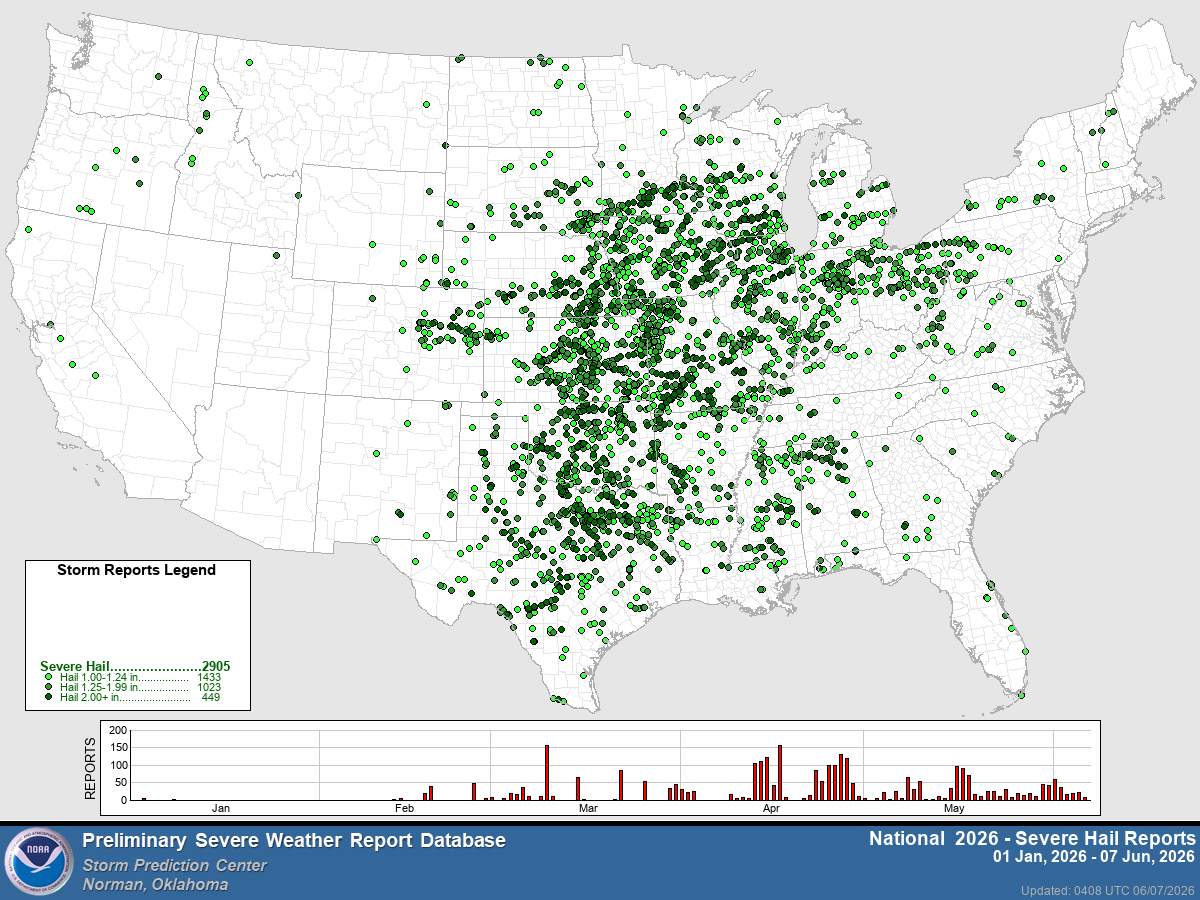
- U.S. Severe Wx & Fire Maps
- U.S. Lightning Center
- Earthquake-Volcano-Monsoon
- Snow Depths & Rainfall Totals
- U.S. 3 Day Precip Type Forecast
- U.S. Snow Depths
- U.S. Observed Precipitation
- National Snow Accumulation
- Northern Hemisphere snow
- Snow Probabilities & Percentile
- U.S. Snow Analyses Maps
- U.S. First Freeze Dates
- U.S. First Snow Dates
- California Rainfall Totals
- California Hydrologic Resources
- Donner Snowfall
- Historic Global Climate Maps
- U.S. Cities Current Air Quality
- U.S. Flight Rules
- U.S. Forecast
- Maps & Radar
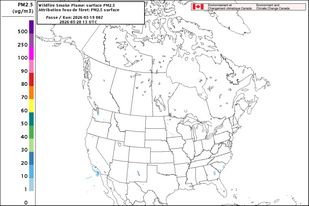
- Smoke
- Radar
- U.S. Interactive Radar Map
- U.S. Regional Radar Maps 2
- U.S. Regional Radar Maps
- U.S. Fullpage Radar Map
- Canada Radar Map
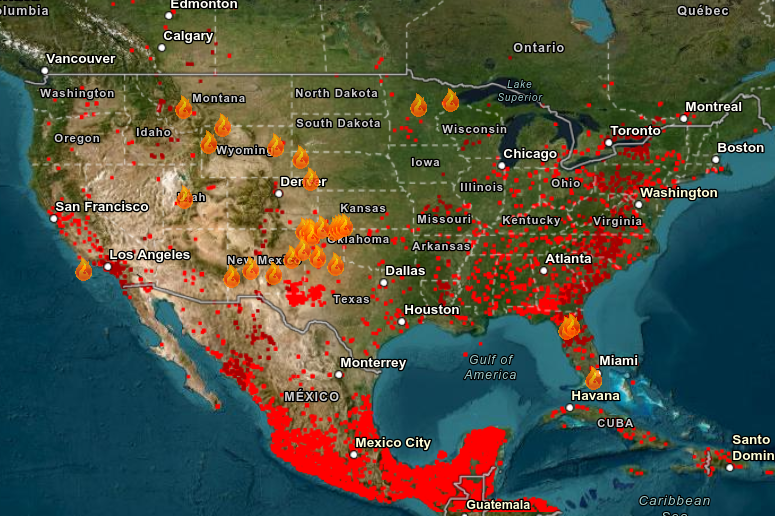
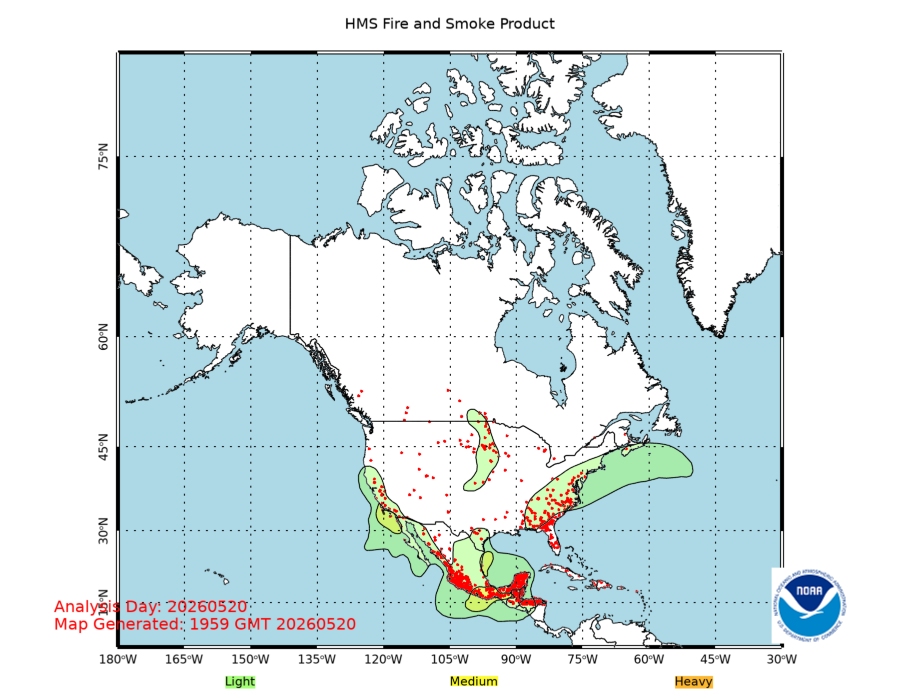
- U.S. Fire Map
- U.S. Observations Map
- Tropical Storms Map
- Alaska Radar Map
- Northeast U.S. Radar Map
- Southeast U.S. Radar Map
- U.S. East Coast Radar Map
- N. Rockies Radar Map
- S. Mississippi Radar Map
- Central Great Lakes
- Pacific NW Radar Map
- Pacific SW Radar Map
- Southern Plains Radar Map
- S. Rockies Radar Map
- Upper Mississippi Valley
- Hawaii Radar Map
- Puerto Rico Radar Map
- U.S. City Radar with controls
- U.S. City Radar with out controls
- Large US Radar
- XLarge U.S. Radar
- World Lightning Radar
- Western U.S. Weather Maps
- Eastern U.S. Weather Maps
- NorCal Inland Radar
- NorCal Coastal Radar
- NorCal Northwest Coast
- Central CA. Radar
- Southern CA. Radar
- Satellite Imagery
- Satellite Directory Listings
- United States Satellite
- U.S. Color Infrared
- U.S. Color Infrared XLarge
- U.S. Visible
- U.S. Infrared
- U.S. Water Vapor
- U.S. Satellite w/Radar
- N America Rainfall Forecast
- N America Rainfall Forecast
- North America IR Satellite
- U.S. Multi Satellite Viewer
- U.S. Interactive Infrared Sat
- Xlarge U.S. Infrared (B/W) Satellite
- Xlarge U.S. Visible Satellite
- Xlarge U.S. Water Vapor Satellite
- Western U.S. & East Pacific
- Western U.S. Color Topo
- Northeast Pacific Topo WV
- N.E. Pacific Color IR
- Entire N. Pacific Sat Color IR
- Western U.S. VIS
- Western U.S. IR
- Western U.S. WV
- Western U.S. AVN
- Western U.S. Rainbow
- Western U.S. RGB
- Northeast Pacific VIS
- Northeast Pacific WV
- Northeast Pacific AVN
- Northeast Pacific Rainbow
- Northeast Pacific RGB
- Northeast Pacific X-Large IR
- Northeast Pacific X-Large VIS
- World Sea Temperatures
- Eastern U.S. & West Atlantic
- Western Atlantic Color Topo IR
- Western Atlantic Color WV
- Western Atlantic Color IR
- Eastern U.S. VIS
- Eastern U.S. IR
- Eastern U.S. WV
- North Atlantic VIS
- North Atlantic IR
- North Atlantic WV
- Western Atlantic Topo IR
- Western Atlantic Color WV
- Western Atlantic Color IR
- Western Atlantic X-large VIS
- Western Atlantic X-large IR
- U.S. - Atlantic - Pacific
- Hemispheric Half Disk Satellite
- GOES-WEST - U.S. & Pac IR2
- GOES-WEST - U.S. & Pac IR4
- GOES-WEST - U.S. & Pac VIS
- GOES-WEST - U.S. & Pac WV
- GOES-EAST - W. Atl & U.S. WV
- GOES16 - Americas GeoColor
- GOES16 - Americas Infrared4
- GOES16 - Americas Visible
- GOES16 - Americas WV
- MET-PRIME - UK & Europe IR
- MET-PRIME - UK & Europe VIS
- MET-PRIME - UK & Europe WV
- COMS - W Pac & Japan IR
- COMS - W Pac & Japan Vis
- COMS - W Pac & Japan WV
- HIMAWARI - W Pac-Guam IR
- HIMAWARI - W Pac-Guam VIS
- HIMAWARI - W Pac-Guam WV
- HIMAWARI - W Pac-Guam RGB
-
Hemispheric Full Disk Satellite
- GOES-EAST 16 GeoColor
- GOES-EAST 16 Longwave IR
- GOES-EAST 16 WV IR
- GOES-WEST 17 GeoColor
- GOES-WEST 17 Longwave IR
- GOES-WEST 17 WV IR
- GOES-WEST 5-Day IR Sat
- GOES-WEST 5-Day VIS Sat
- GOES-WEST 5-Day WV Sat
- MET-PRIME - Eur. & Africa IR
- MET-PRIME - Eur. & Africa VIS
- MET-PRIME - Eur. & Africa WV
- HIMAWARI - W Pac to Aus IR
- HIMAWARI - W Pac to Aus VIS
- HIMAWARI - W Pac to Aus WV
- HIMAWARI - W Pac & Aus RGB
- COMS-1 - W Pac to Aus IR
- COMS-1 - W Pac to Aus VIS
- COMS-1 - W Pac to Aus WV
- FY2G - Ind Ocean & China IR
- FY2G - Ind Ocean & China VIS
- FY2G - Ind Ocean & China WV
- MET-IODC - Africa-Mideast IR
- MET-IODC - Africa-Mideast VIS
- MET-IODC - Africa-Mideast WV
-
Extra Wide View Satellite
- Western Atlantic & Pacific
- West Atlantic Color Topo IR
- West Atlantic Color Sat IR
- West Atlantic Satellite IR
- W Atlantic Sat Color Topo WV
- West Pacific Color Topo IR
- West Pacific Color Sat IR
- West Pacific Satellite IR
- West Pac Sat Color Topo WV
- S Pacific Color Topo IR
- SSW Pacific Ocean Color IR
- SSW Pacific Satellite IR
- S Pac Sat Color Topo WV
- S. Pacific Sat Color Topo IR 2
- S. Pacific Sat Color IR 2
- S. Pacific Sat WV 2
- N. Pacific GeoColor Satellite
- N. Pacific WV Satellite
- UK & Europe Satellite
- Indian Ocean Satellite
- Africa Satellite
- Global Satellite
- Canada Satellite
- Arctic & Antarctic IR Sat
- Alaska Satellite
- Hawaii Satellite
- U.S. Fire Monitoring Satellite
- Smoke
- Models
- Surface Analysis Dirctory
- North America Models
- HRRR Hourly - U.S. High Res
- HRRR-SubHourly - High Res
- RAP - (Rapid Refresh) Listings
- RUC - (Rapid Update) Listings
- HREF - Listings
- HREF U.S. Southwest Listings
- SREF Listings
- GFS Listings
- GEFS Ensemble Listings
- GEFS Spaghetti Listings
- GFS Alaska Listings
- NAM Listings
- NAEFS Listings
- U.S. Color Surface Map
- U.S. Surface Map
- Current U.S. Mesoscale Alerts
- U.S. SPC Mesoscale Analysis
- Western U.S. Surface Map
- Midwest Surface Map
- Southeast U.S. Surface Map
- Canada Surface Map
- Gulf-Mexico-Caribbean Sur Map
- U.S. GFS-LAMP Analysis
- Eastern & Western U.S.
- Alaska Models
- Polar Models
- Arctic Models
- Europe Models
- North Pacific Models
- East Pacific Models
- Atlantic Models
- Western North Atlantic Models
- Caribbean Models
- Atlantic & Pacific Models
- South Pacific Models
- Africa Models
- Asia Models
- India & Pakistan
- Australia
- South America
- N. America - U.S. Surface Maps
- U.S. HPA Layer Models
- NE. Pacific 700-850-HPA Layer
- NE. Pacific 500-850-HPA Layer
- NE. Pacific 400-850-HPA Layer
- NE. Pacific 300-850-HPA Layer
- NE. Pacific 250-850-HPA Layer
- NE. Pacific 200-700-HPA Layer
- W. Atlantic 700-850-HPA Layer
- W. Atlantic 500-850-HPA Layer
- W. Atlantic 400-850-HPA Layer
- W. Atlantic 300-850-HPA Layer
- W. Atlantic 250-850-HPA Layer
- W. Atlantic 200-700-HPA Layer
- U.S. Converge & Diverge
- U.S. Wind Shear & Vorticity
- North Polar Ice Drift
- Canada
- Radar & Satellite
- Radar
- Canada Radar
- Pacific Province Radar
- Prairies Province Radar
- Ontario Province Radar
- Quebec Province Radar
- Atlantic Province Radar
- Canada Regional Radar
- Canada Radar Status
- Canada Aviation Webcams
- N. America Lightning Strikes
- National Satellite
- Canada GeoColor IR Satellite
- Canada Infrared Sat Loop
- Canada Xlarge IR Sat Photo
- Canada Infrared Sat Photo 1
- Canada Infrared Sat Photo 2
- Canada Visable Sat Photo
- Canada Composit w/ Arctic
- Regional Satellite
- West Canada Xlarge IR Sat
- East Canada Xlarge IR Sat
- Canada Fire
- Current Conditions
- Canada Statements & Alerts
- Marine Warnings & Forecast
- Canada Sea Ice Charts
- Canada Climate Directory 1
- Canada Climate Directory 2
- Canada Average Rainfall
- Recent Canada Earthquakes
- Radar & Satellite
- World Wx
- World Weather Information
- World Lightning Radar
- Global Lightning Radar
- North America Lightning Radar
- Europe Lightning Radar
- Central Europe Lightning Radar
- Southeast Europe Lightning Radar
- UK Lightning Radar
- Africa/Mideast Lightning Radar
- South Africa Lightning Radar
- Australia & N.Z. Lightning Radar
- New Zealand Lightning Radar
- Asia Lightning Radar
- South America Lightning Radar
- S.W. Pacific U.S. Lightning Radar
- Global Total Precipitable Water
- World Climate Directory
- World Temperature Extremes
- World Drought Map
- World Wind Direction Animation
- World High Temperatures Map
- World Low Temperatures Map
- World Sea Surface Temps
- World Realtime Maps
- World Annual Temperatures Map
- World Satellite Directory
- Entire World IR Satellite
- XLarge World IR Satellite
- Western Hemisphere Sat
- Antarctica Composite Sat IR
- Antarctica Satellite Photo
- World Lightning Radar
- World Current Conditions
- World Current Conditions
- N. America Current Conditons
- U.S. Current Conditons
- Alaska Current Conditons
- Hawaii Current Conditons
- Africa Current Conditons
- Australia Current Conditons
- Canada Current Conditons
- Caribbean Current Conditons
- Central America Conditons
- Eastern Europe Current Conditons
- Middleeast Current Conditons
- Mexico Current Conditons
- New Zealand Conditons
- North Asia Current Conditons
- South America Current Conditons
- South Asia Current Conditons
- UK Current Conditons
- W. Europe Current Conditons
- Europe Infrared Satellite
- Europe Infrared Satellite
- Alps Infrared Satellite
- Balkans Infrared Satellite
- Baltic Infrared Satellite
- France Infrared Satellite
- Germany Infrared Satellite
- Greece Infrared Satellite
- Hungary Infrared Satellite
- Italy Infrared Satellite
- Netherlands Infrared Satellite
- Poland Infrared Satellite
- Russa Infrared Satellite
- Scandinavia Infrared Satellite
- Southeast Europe IR Satellite
- Spain Infrared Satellite
- Turkey Infrared Satellite
- UK Infrared Satellite
- Africa Infrared Satellite
- Africa Infrared Satellite
- Algeria Infrared Satellite
- Canary Islands IR Satellite
- Cameroon Infrared Satellite
- Central Africa Infrared Satellite
- Chad Infrared Satellite
- Congo Infrared Satellite
- Egypt Infrared Satellite
- Ethiopia Infrared Satellite
- Israel Infrared Satellite
- Libya Infrared Satellite
- Madagascar Infrared Satellite
- Morocco Infrared Satellite
- Namibia Infrared Satellite
- Saudi Arabia IR Satellite
- Somalia Infrared Satellite
- South Africa IR Satellite
- Sudan Infrared Satellite
- Tanzania Infrared Satellite
- Tunisia Infrared Satellite
- West Africa IR Satellite
- Zambia Infrared Satellite
- Europe Animated Radar
- Europe Animated Radar
- Alps Animated Radar
- Balkans Animated Radar
- Baltic Animated Radar
- France Animated Radar
- Germany Animated Radar
- Greece Animated Radar
- Hungary Animated Radar
- Netherlands Animated Radar
- Poland Animated Radar
- Russia Animated Radar
- Scandinavia Animated Radar
- Southeast Europe Radar
- Turkey Animated Radar
- Africa Animated Radar
- Africa Animated Radar
- Algeria Animated Radar
- Australia & N. Zealand Radar
- Cameroon Animated Radar
- Canary Islands Radar
- Central Africa Radar
- Chad Animated Radar
- Congo Animated Radar
- Egypt Animated Radar
- Ethiopia Animated Radar
- Israel Animated Radar
- Libya Animated Radar
- Madagascar Animated Radar
- Morocco Animated Radar
- Namibia Animated Radar
- Saudi Arabia Animated Radar
- Somalia Animated Radar
- South Africa Animated Radar
- Sudan Animated Radar
- Tanzania Animated Radar
- Tunisia Animated Radar
- West Africa Animated Radar
- Zambia Animated Radar
- Africa
- Africa/Mideast Lightning Radar
- Africa Current Conditions
- Africa Infrared Satellite
- Africa Visible Satellite
- Africa Animated Radar
- Eastern Hem Full Disk IR Sat
- Eastern Hem Full Disk VIS Sat
- Eastern Hem Full Disk WV Sat
- NW Indian Ocean Color IR
- NW Indian Ocean Sat Color IR
- NW Indian Ocean Sat IR
- NW Indian Ocean Color WV
- South Africa
- Asia - Northern & Central
- Asia - Eastern & Southeastern
- Asia - Southern & Southwest
- Europe - British Isles
- Live UK Weather Alerts
- Current Weather Conditions
- British Iles IR Satellite
- British Iles VIS Satellite
- British Isles Radar
- Satellite Imagery
- Europe Infrared Satellite
- Europe Visible Satellite
- British Isles Infrared Satellite
- British Isles Visible Satellite
- British Isles IR Closeup Sat
- UK & European Half Disk Sat VIS
- UK & European Half Disk Sat IR
- UK & Europe Half Disk Sat WV
- Europe 12hr Satellite Loop
- Europe 24hr Satellite Loop
- Spain & Portugal IR Satellite
- Europe IR Color Topo Satellite
- Average Rainfall
- British Isles Rainfall Forecast
- UK Cities Live Conditions
- Live Current Conditions Map1
- UK Live Weather Map
- Scotland Live Weather Map
- UK & Ireland Lightning Radar
- British Isles Buoy's
- Recent UK Earthquakes
- 24-168 Hr Temp Forecast
- Total Precipitable Water
- Anomoly Precipitable Water
- Europe - Western
- Europe - Eastern
- Europe Current Conditions
- Europe Animated Radar
- Europe Severe Weather Map
- Eastern Europe IR Satellite
- Eastern Europe VIS Satellite
- UK & European Half Disk Sat VIS
- UK & European Half Disk Sat IR
- UK & Europe Half Disk Sat WV
- Europe 12hr Satellite Loop
- Europe 24hr Satellite Loop
- Europe Live Lightning Radar
- Poland Live Weather Map
- Slovakia Live Weather Map
- Slovenia Live Weather Map
- Israel
- Caribbean
- Greenland
- Mexico
- Middle East
- Oceania - Australia
- Oceania - New Zealand
- North America
- South America
- Central America
- World Weather Information
- Tropical
- More
- Historic Global Maps
- Weather Documents
- Natural Science
- Placerville CA Wx Records
- Placerville Mobile Live
- Live Weather Gauges
- Moon & Stars
- CoCoRaHS Precipation Map
- 2016 Solar Risings/Settings
- Daily Placerville Temp Summary
- Historic Daily Wx Extremes
- Historic Daily Temp Extremes
- Historic Rain/Temp Details
- Current Weather Trends
- Weather Station History
- Historic Weather Data
- Normals, Averages & Records
- 2 to 7 Day Wx Statistics
- Mesowest Current Conditions
- Monthly & Yearly Records
- Daily Weather Details
- Daily Rainfall Calendar
- Historic Rainfall
- Current Weather Graphs
- California Average Rainfall
- Miscellaneous
- Mobile Live Weather Conditions
- Mobile Placerville Forecast
- NOAA LIVE Weather Radio
- Air Quality Report
- Watering Index
- Irrigation Index
- Burn Index
- Current Area Weather Alerts
- LIVE I
- LIVE II
- Live III
- Live Weather Gauges
- LIVE WebCam
- Lightning Radar
- El Dorado County Burn Days
- Latest El Nino / La Nina Maps
- Space Station Live ISS Feed
- Conversion Calculators & Tools
- Sitemap
- About Us!
- Historic Global Maps